 CARIGE
← Use cases
Infrastructure & heritage · Real demonstration
From the 3D model to detailed analysis.
A photogrammetric survey of Redoute church in Martinique, developed into a 3D model, surface maps and geometric profiles.
Redoute church, Martinique6,456 drone photographsMillimetre image detail depending on the photographs
1 · The 3D model
A shared basis for inspection.
The textured model lets users locate observations, take dimensions and share a view of the structure.
- rotate around the building, inspect a detail, view from above or either side;
- measure a distance or an area directly on the model;
- annotate a defect with a category and a comment;
- share the view by WhatsApp or email, export the image and the measurements table.
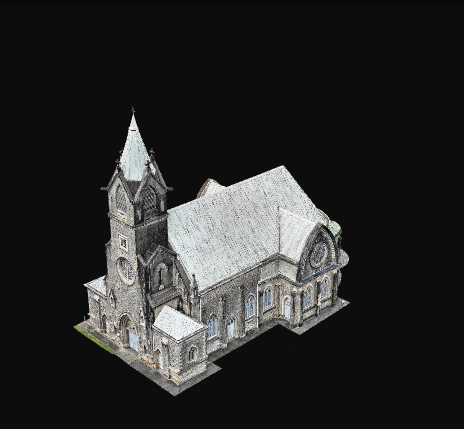 drag: rotate · scroll: zoom
2 · Roofs
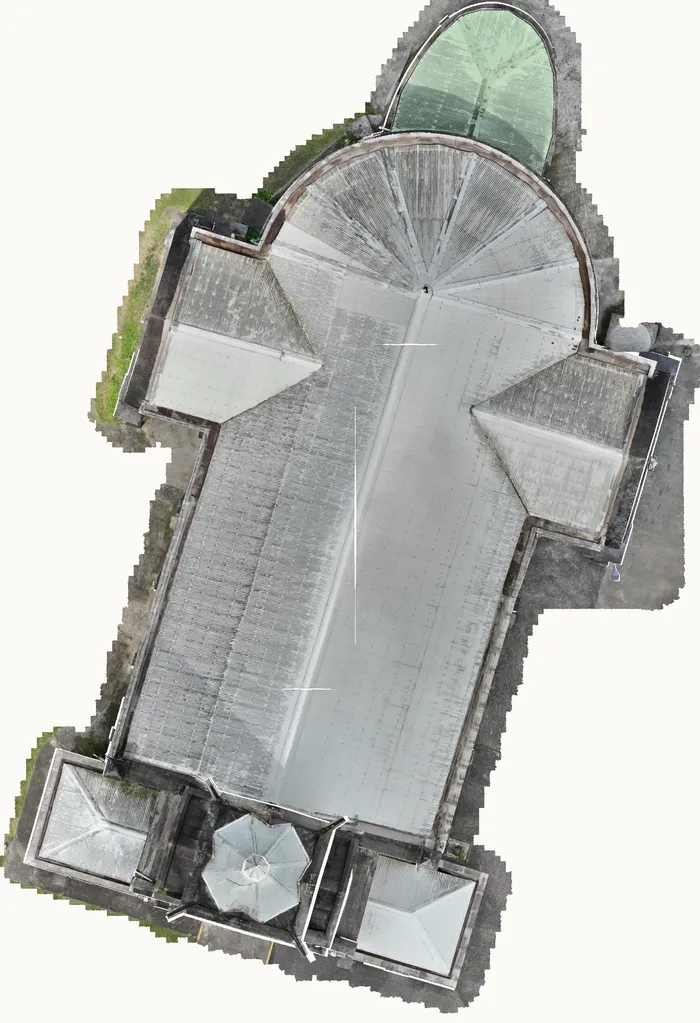
Roof-panel darkening index · brightness comparison, not a percentage of stained surface
high index · 10–16%intermediate index · 5–9%low index / reference · 0–4%
Understanding roof darkening.
- Observation
- Distinct dark marks occur on some roof planes, particularly to the north and west, and are also visible on the facades. Their distribution motivates investigation of exposure-related biological colonisation, including cyanobacteria (sometimes called ‘black algae’).
- Analysis
- Comparing roof planes within the same photograph yields a darkening index of up to 16%. Some classes are supplemented by visual interpretation. The distribution supports investigating biological colonisation, without identifying an organism or establishing causation. Orientation, lighting, reflectance, moisture, deposits and material ageing may also contribute. A single photograph does not ensure identical lighting on every plane. A low value may denote a reference surface and does not prove the absence of deposits. Biological identification requires on-site verification.
3 · Rust
Locating signs of corrosion.
- Observation
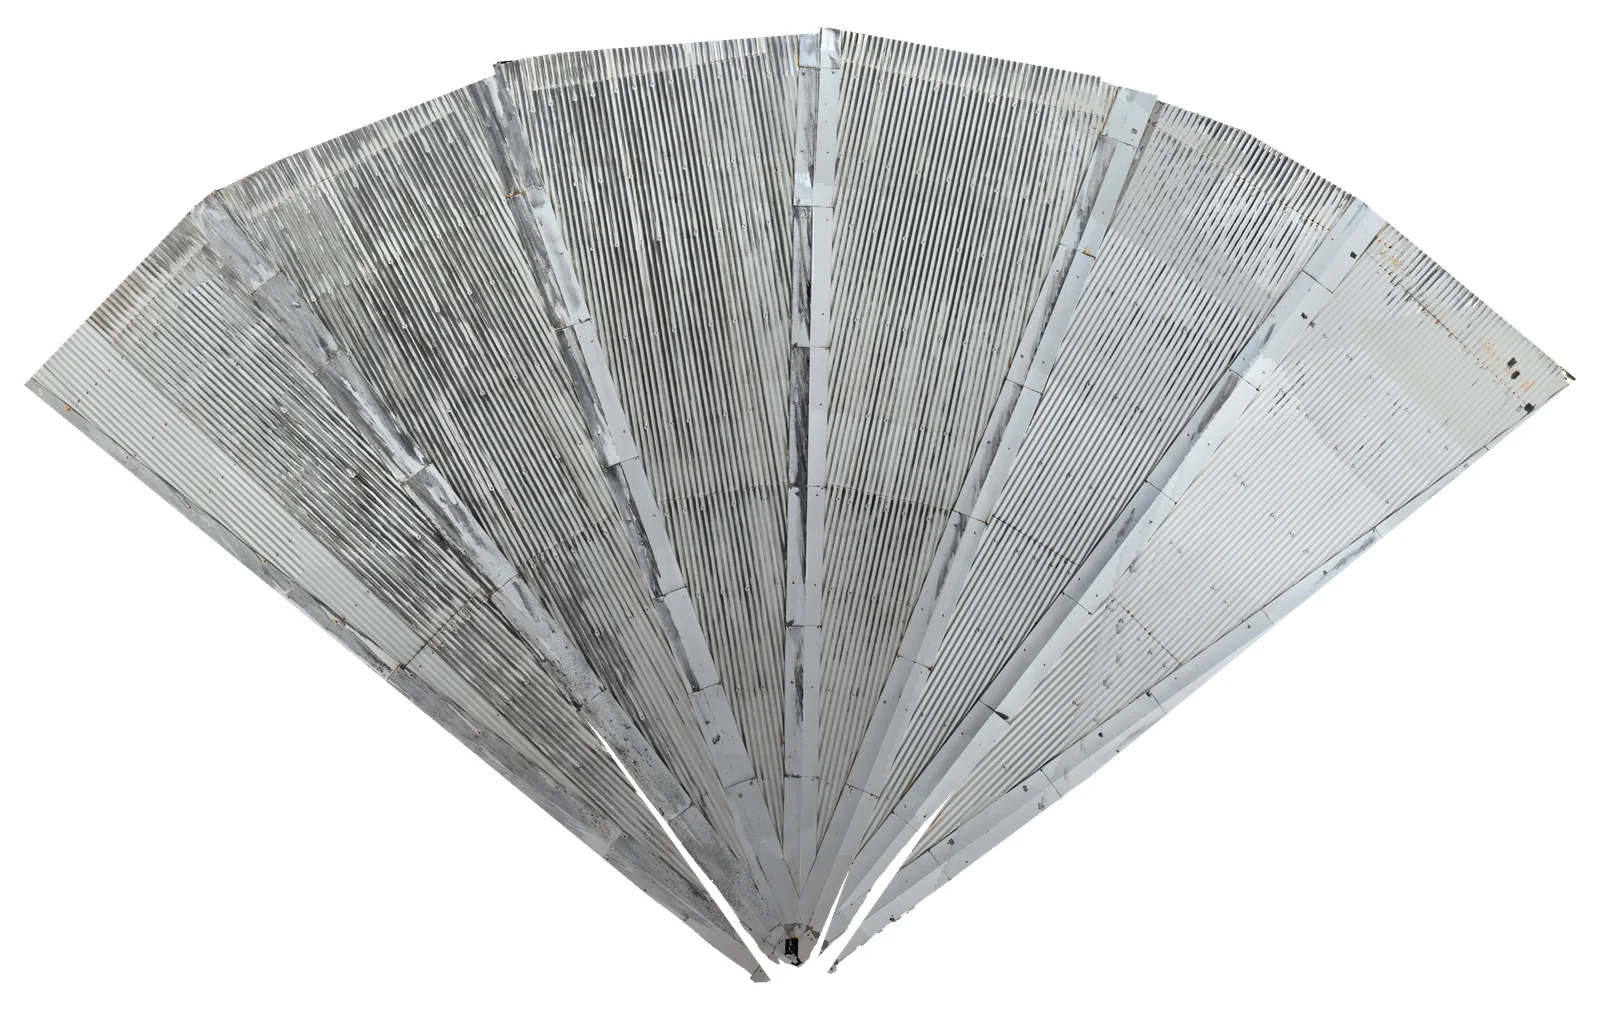
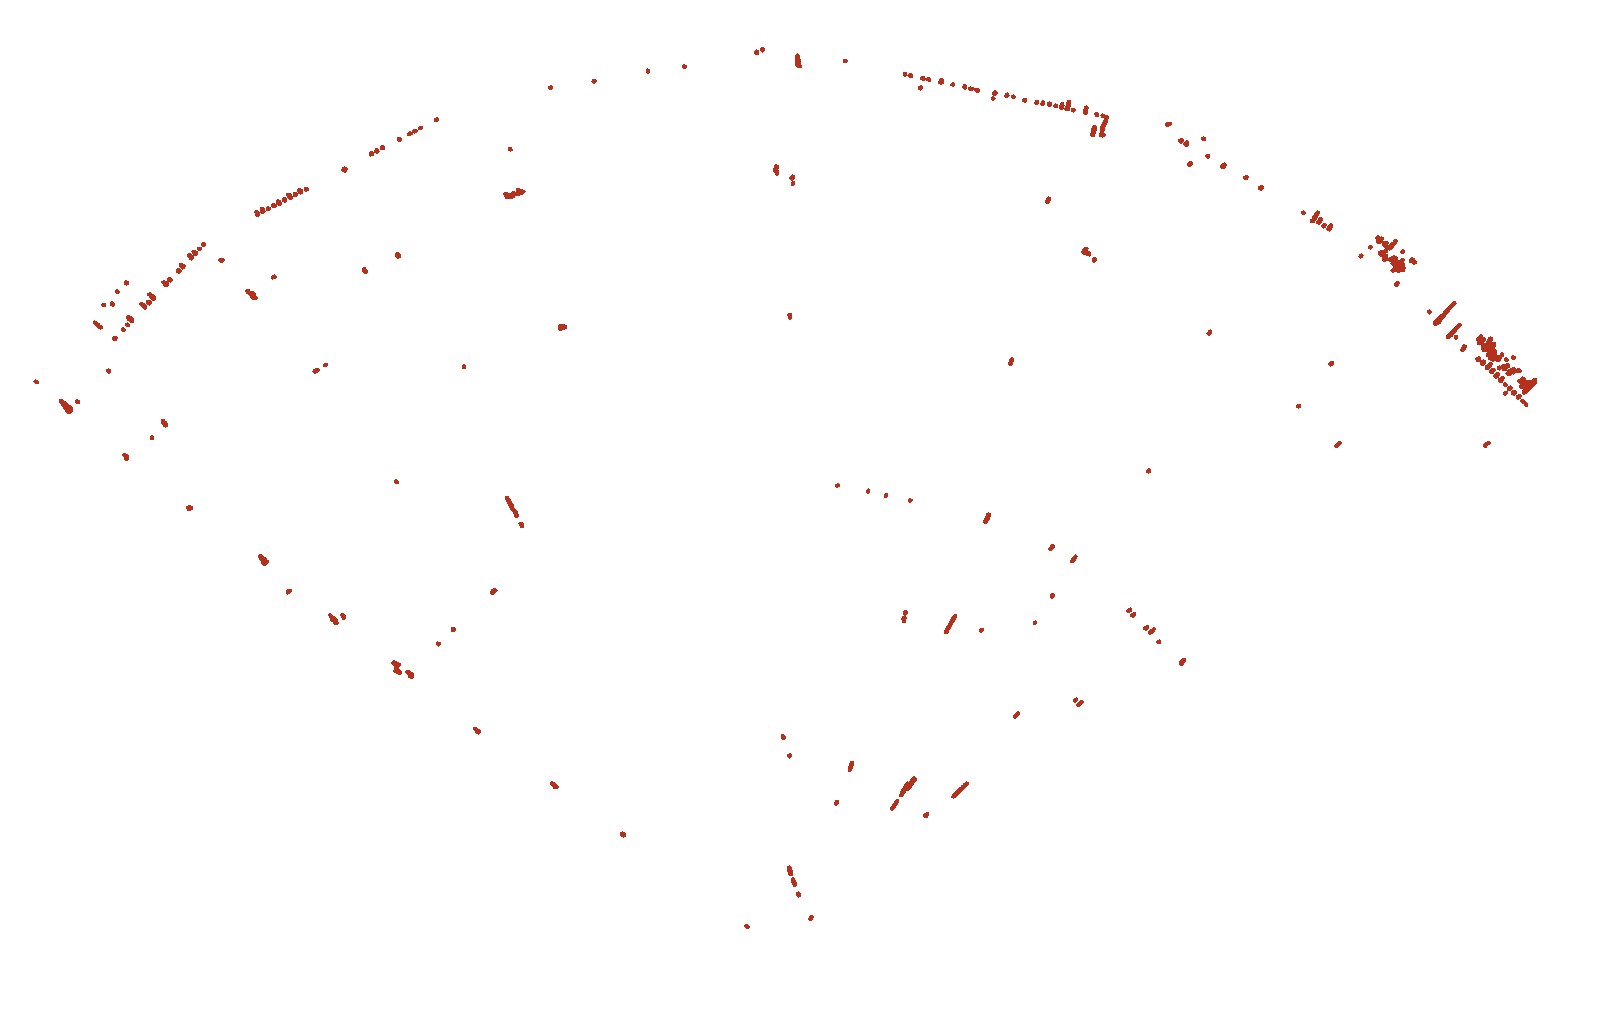
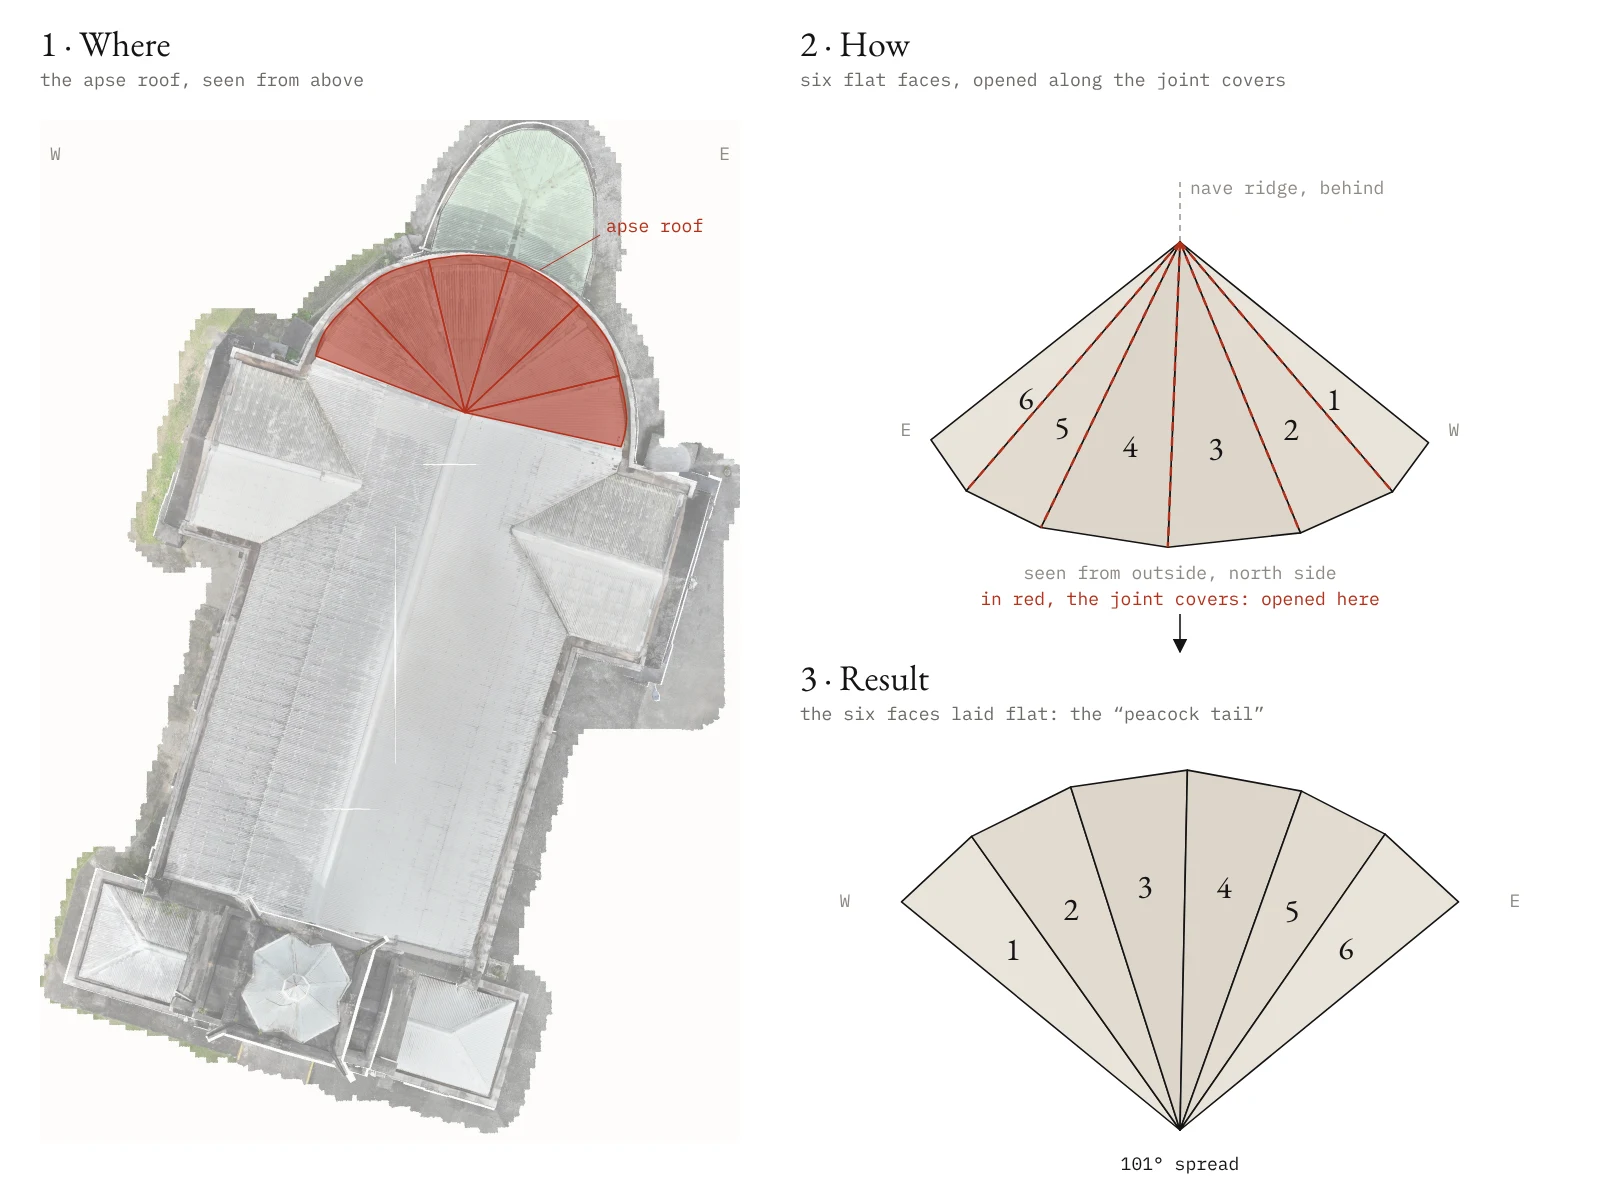
- Six planar sheet-metal facets developed onto a plane: a fan-shaped map reconstructed from the original photographs.
- Analysis
- Colour segmentation, followed by removal of elements outside the roof, isolates 249 rust-like patches, approximately 0.2% of the surface analysed in this version. Their distribution can be examined at overlaps and fasteners. This mapping locates areas for inspection; it does not measure metal thickness loss.
4 · North gutter
Analysing the north gutter profile
- Observation
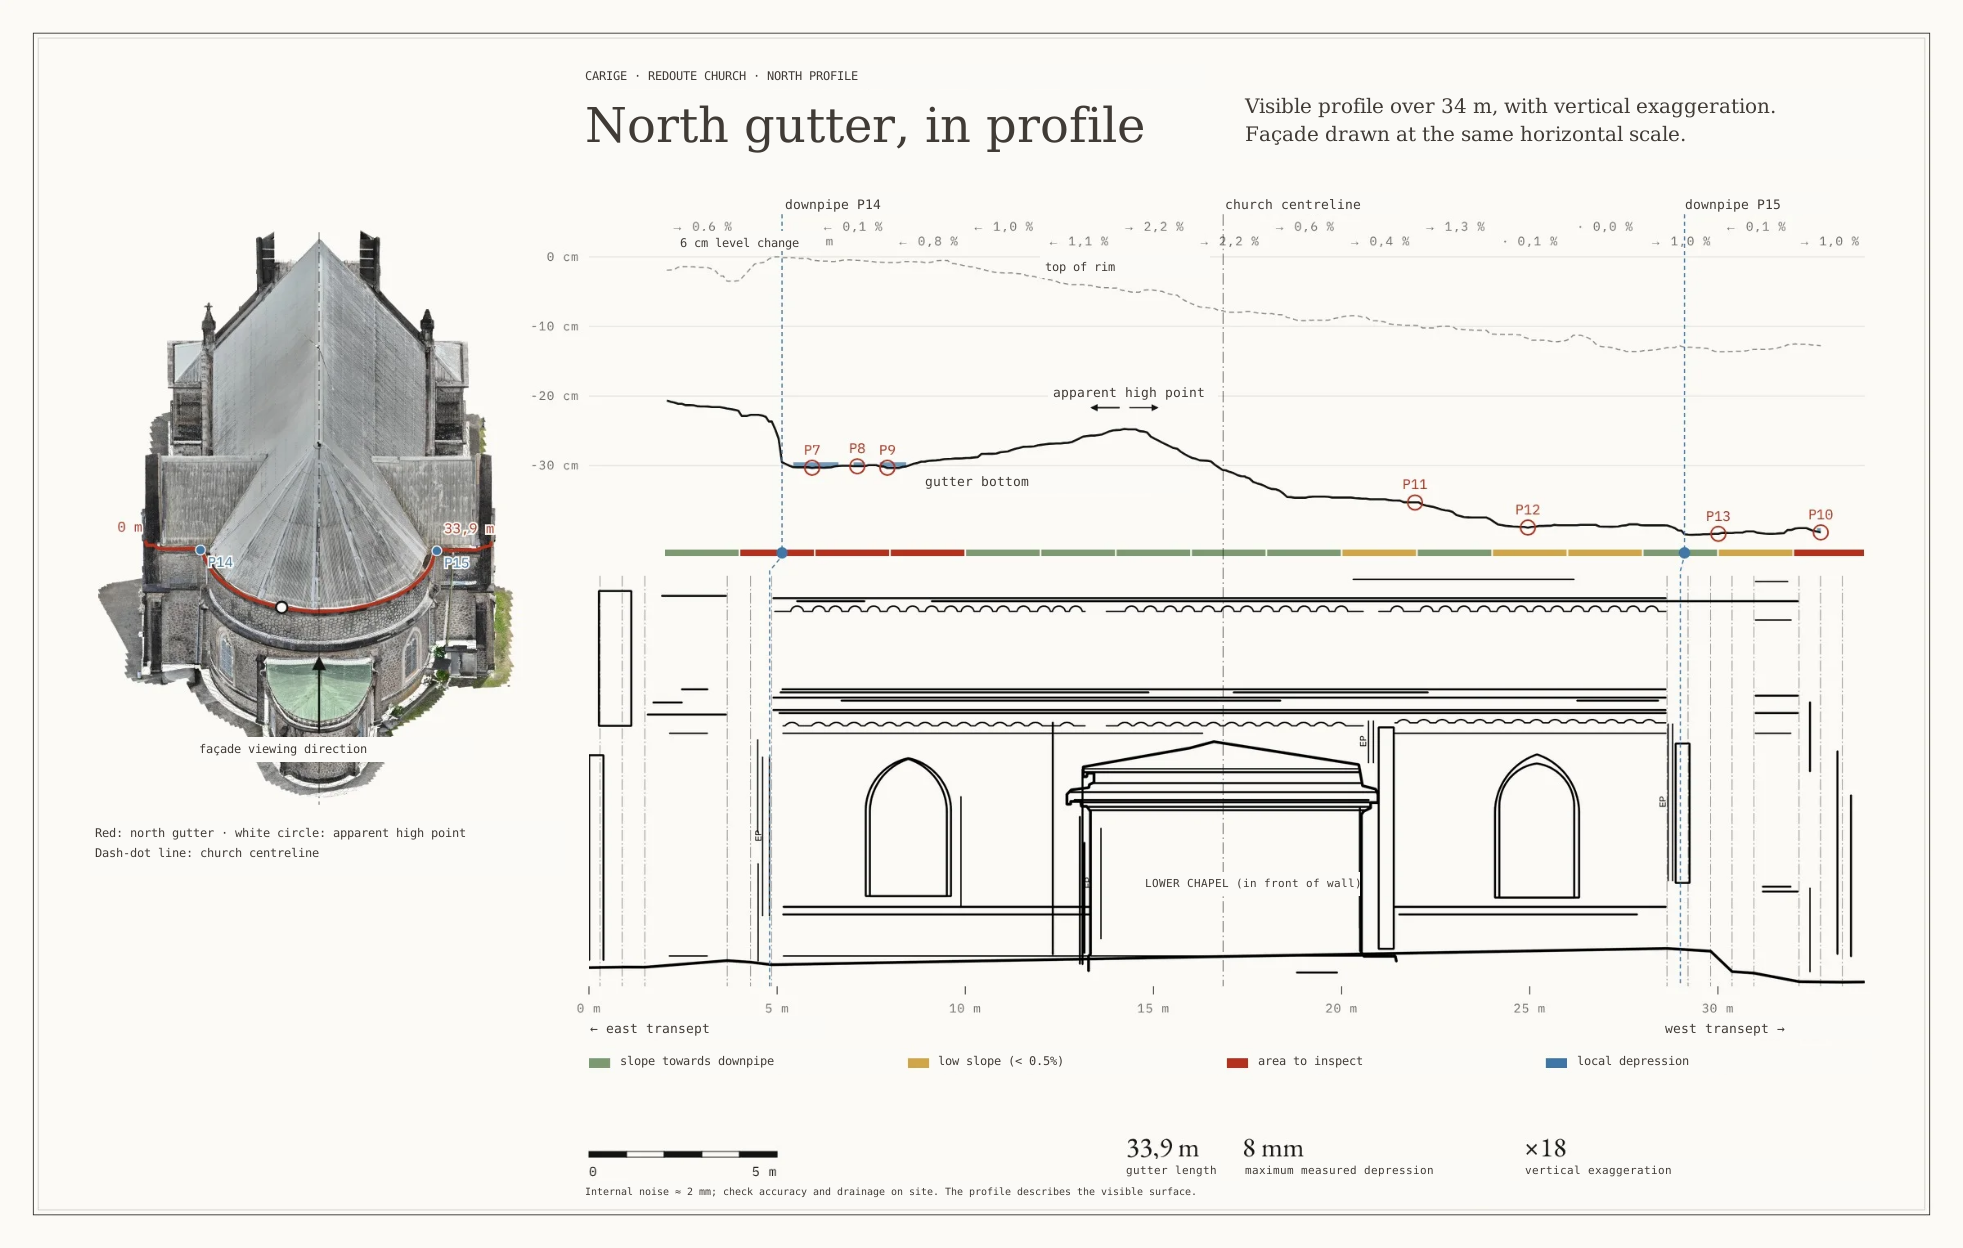
- Longitudinal profile of the visible surface at the bottom of the gutter: one point every 10 cm over approximately 34 m. Internal noise in the smoothed profile is around 2 mm; this is not an absolute accuracy figure. The facade uses the same horizontal scale, with vertical relief exaggerated.
- Analysis
- The maximum in the exported profile is at chainage 14.23 m, 2.62 m from the church axis. A level change of approximately 6 cm is identified at P14. Depressions of 5–8 mm appear between P7 and P9. Hydraulic interpretation requires on-site checks of openings, deposits and outlet levels.
5 · Cracks
Mapping cracks around the window.
Semi-automated detection with manual checking and tracing on the façade orthophoto.
- Observation
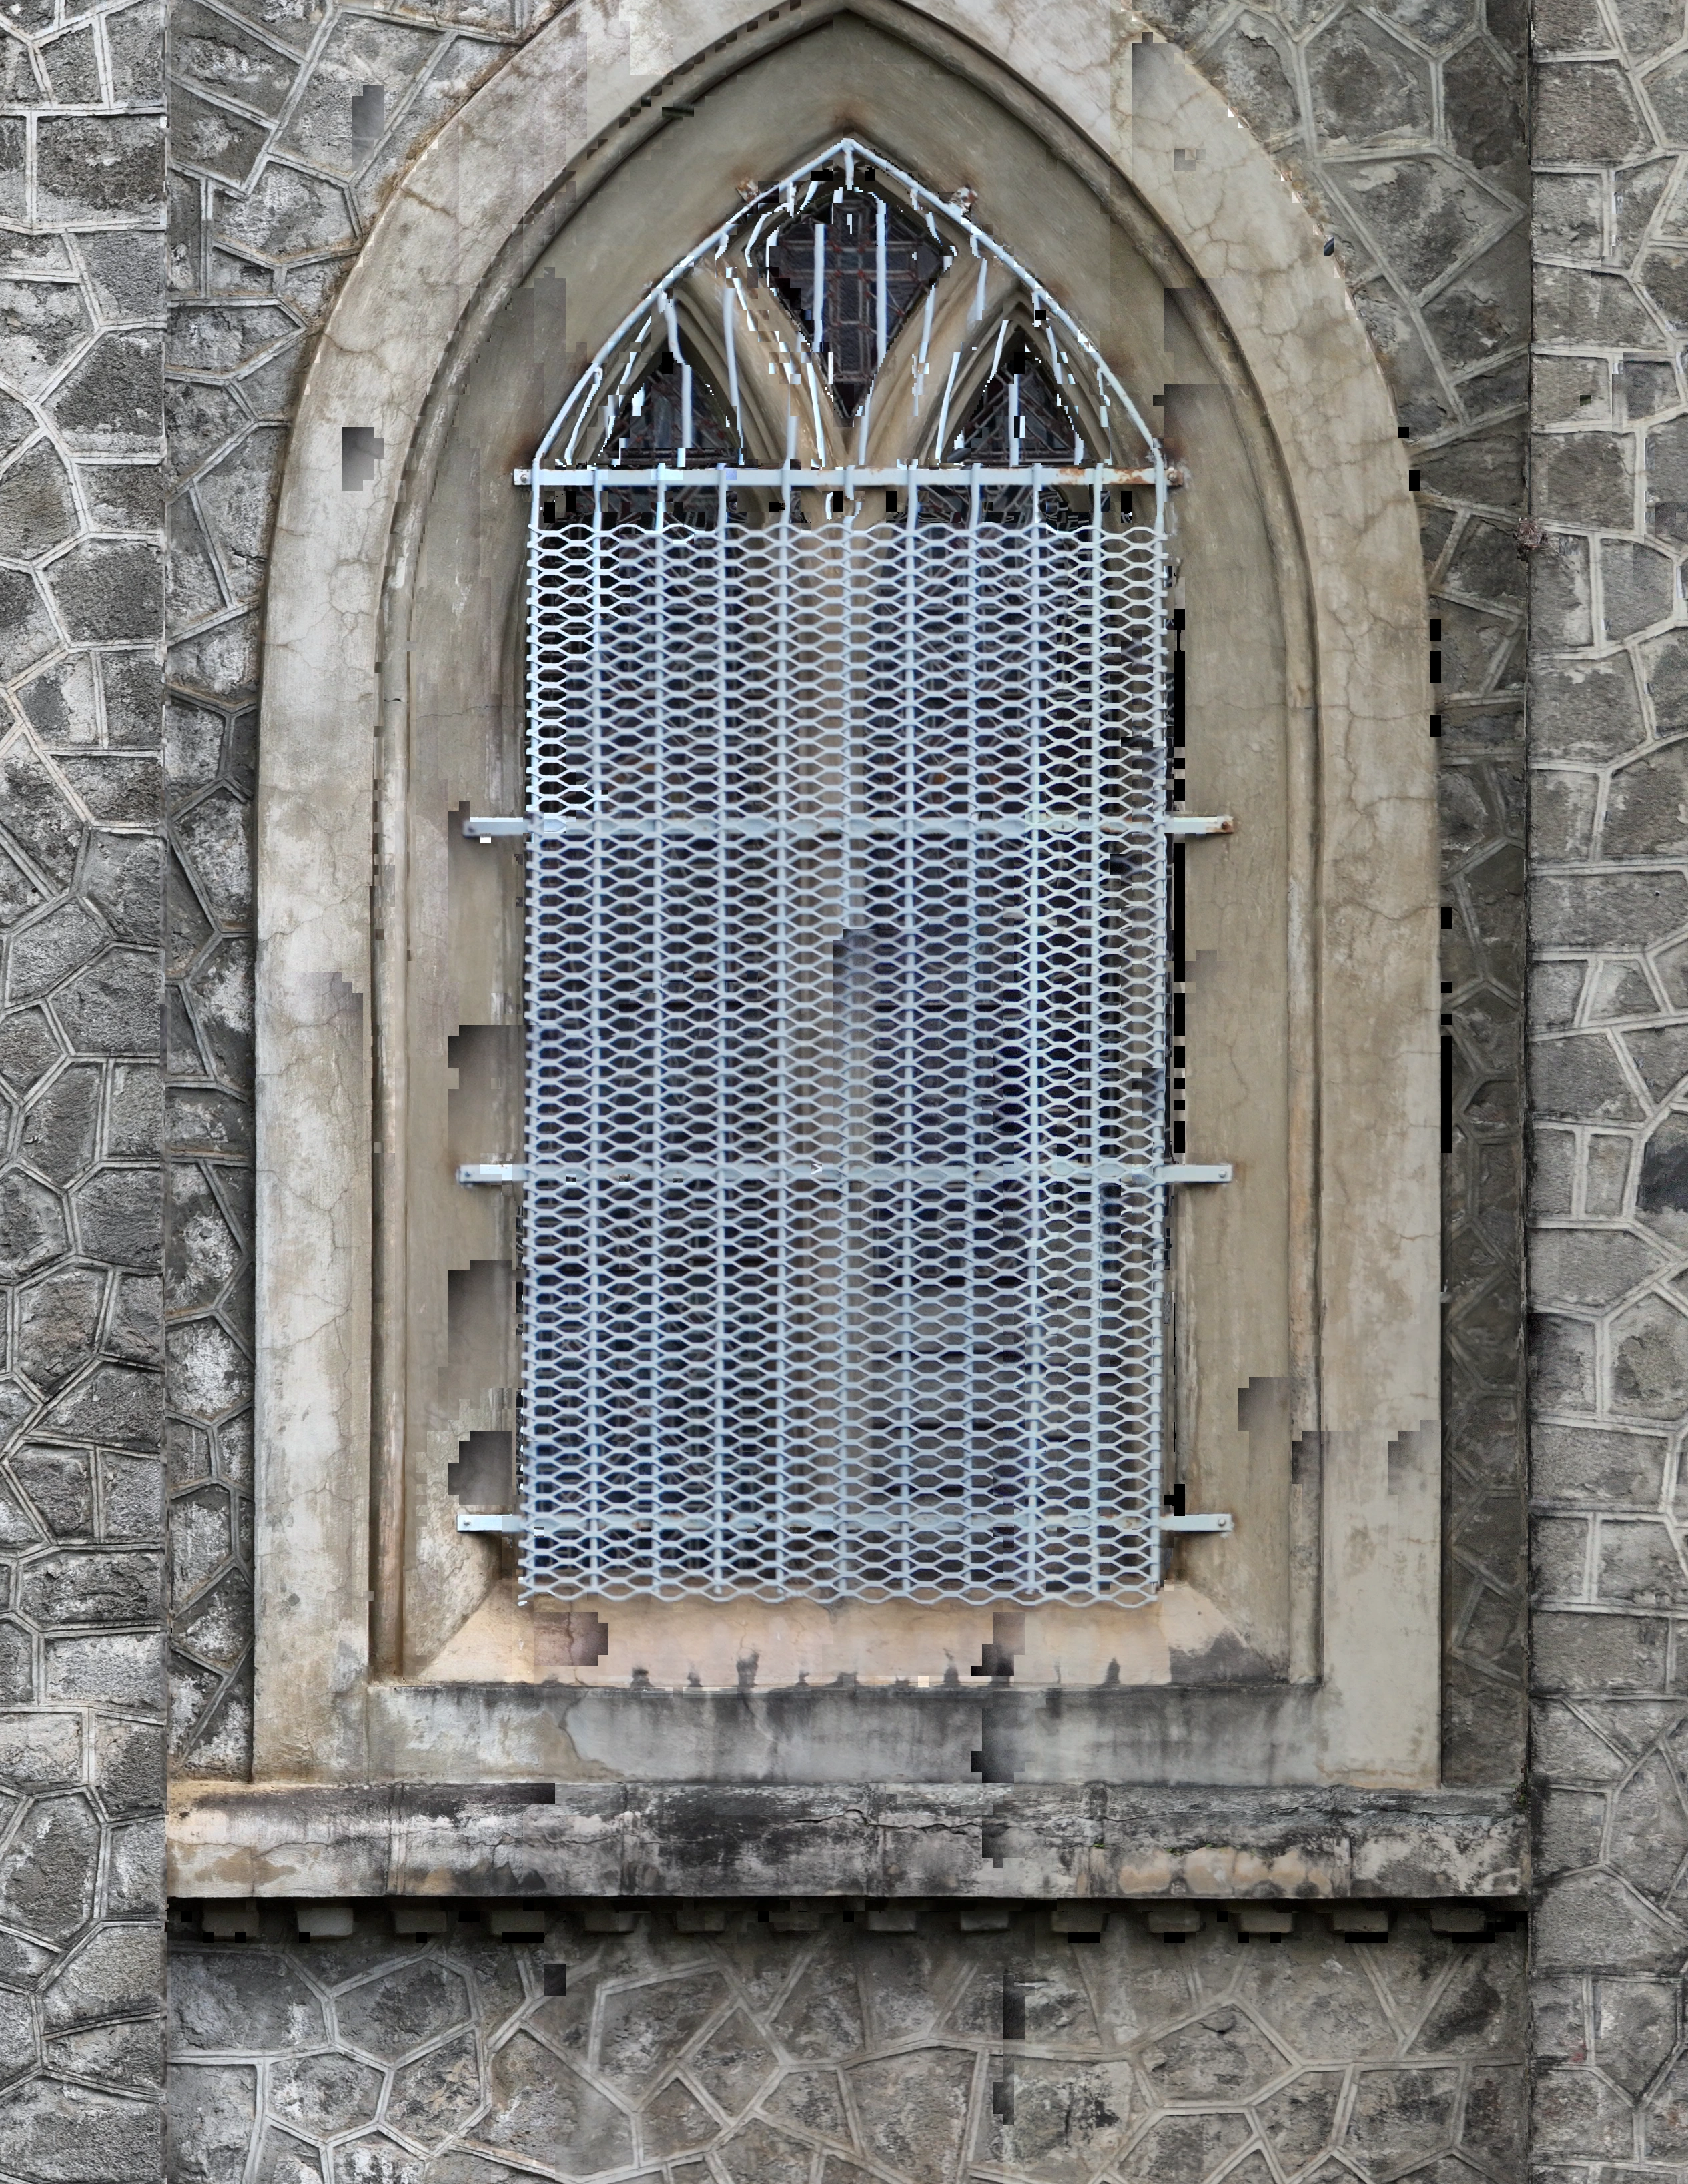
- Manual annotations follow visible discontinuities along the jambs, arch and sill. They locate areas to examine and provide a shared reading of the façade.
Method and limitations
Semi-automated detection followed by manual checking and tracing on an orthophoto with a pixel spacing of 1.5 mm. They are visual annotations: several strokes may belong to the same crack. They do not measure crack width or establish severity or cause. Mosaic seams and surface relief require checks against the original photographs and, where needed, on site.
A small part of the world is in your care. We help you look after it.
Semi-automated crack detectionsemi-automated detection with manual checking and tracing
Online 3D modelmeasurements, annotations and sharing in the browser
Developed surface mapsroofs and facades, to scale
Detection mapsrust candidates and darkening, quantified and located
Profiles and reportdrainage geometry and condition survey